Understanding LISA interest rates: a comprehensive guide
Understanding LISA interest rates is crucial for individuals looking to make informed d...

When my son was born 21 years ago, the mother and baby magazines were chock-a-block with adverts and marketing materials for the Invesco Perpetual Rupert fund, the only investment at the time sold to parents as a long-term investment for children. (Witan went on to launch the Jump savings plan and Aberdeen the Thomas the Tank Engine savings plan a few years later.) Keen to do my lioness bit, I signed up directly with Invesco, investing £500 in November 1997 and £50 every month thereafter.
Over time that £50 became smaller and I barely noticed it coming out of my current account. The fact that it was a direct investment and not on my D2C Fidelity account meant that I only very occasionally reviewed it (blue moon territory) and the standing order quietly rolled on for 21 years. In fact it’s still running. Worse still, when RDR came and went, I made no attempt to move it to a fat-free share-class despite everything I know (yep, I know, terrible mother, slap me).
So how did my investment do? Between November 1997 and October 2017, I invested a total of £12,450 and nearly tripled my investment to £30,795 by October 2017. Essentially for every £1 invested, I got £2.50 back. So far, so good. But what if I’d left my money to grow in a bank account or if I’d invested it in a passive tracker? At the back of my mind was the nagging feeling that I’d been lackadaisical with my son’s investment, so it was time to find out if I’d screwed up.
I decided to test how my money would have fared in a tracker fund and an instant access deposit account. To prevent a legion of passive evangelists ripping the test to bits, I tasked the Fundscape data team with finding the worst performing UK All Companies active fund to provide context. The investments were as follows:
The active and passive data was sourced from FE Analytics, and was net of fund charges levied throughout the period under review. Meanwhile, we went to the Bank of England for the instant access deposit interest rates. Both sets of data were sourced on a monthly basis to provide a more accurate, month-by-month analysis.
We ran the test over a 20-year period from November 1997 to October 2017 and the same investment plan was applied to all four — a lump sum of £500 in the first month followed by monthly investments of £50. The Fundscape team analysed the returns on both inflation-adjusted and non-inflation-adjusted bases. To adjust for inflation, we used the monthly UK CPI inflation rate sourced from the Office of National Statistics (ONS). We have used the inflation-adjusted data in the chart below.
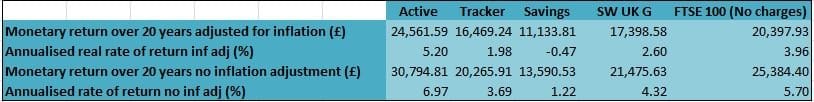
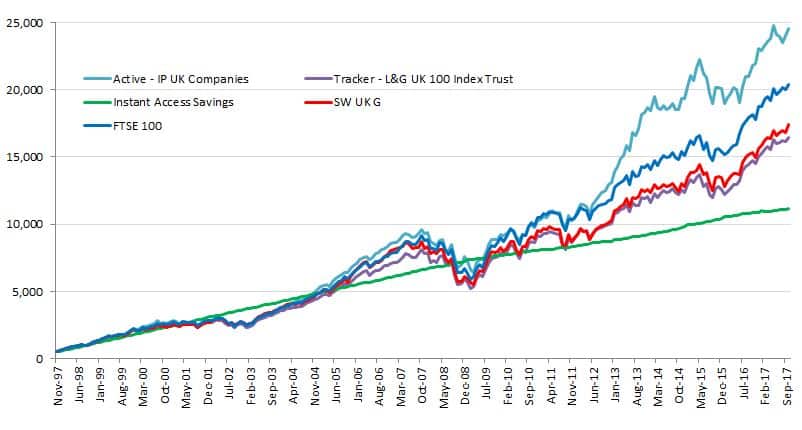
The chart and table illustrate the growth of the investments. We found (phew!) that the Rupert fund (now the IP UK Companies fund) outperformed its peers by a considerable margin. My son’s investment attracted an inflation-adjusted return of £24,561 (5.2%), outperforming the FTSE 100 (£20,397, 3.96%) and the tracker’s inflation-adjusted return of £16,469 (1.98%). (The FTSE 100’s returns are higher than the tracker as there are no fees.)
On paper, the worst performer was the instant access savings account, which had an inflation-adjusted return of £11,133, less than the total invested over time — an annualised real rate of return of -0.47%. Of course, there are short periods of time around the dotcom crash and the 2007-8 financial crisis where the returns from the active and passive funds fell below those of the instant access savings account, but they’re pretty shortlived.
Arguably, the worst investment performance came from the Scottish Widows UK Growth fund, which is in reality a closet index-tracker with active, full-fat fees. The monetary difference between this fund and the L&G tracker was less than £1,000 over the entire 20-year period — proof that an index tracker is always going to be a better option than expensive and mediocre active funds.
The other point to mention here is survivorship bias. Funds that are still ‘live’ after all this time are more likely to have had better performance in the long run. The worst funds of the period would have been merged away or closed, which means that the Scottish Widows UK Growth is probably the best of a bad bunch.
It is also worth noting that my investment in the Rupert fund didn’t get off to a good start, with the fund languishing at the bottom of the performance tables until 2004. Obviously it was in the grip of a bear market in 2002/2003, but it took a particularly heavy hammering and was bottom quartile over two, three and five years.
I don’t remember being particularly upset about its performance and probably (philosophically) blamed it on the market rather than the manager’s expertise (trust me, I was much more worried about my Tech fund). In 2004 Invesco Perpetual acknowledged the fund’s persistent underperformance and replaced the manager, David McGillveray, with Martin Walker. The strategy worked. Martin Walker took over in early 2004 and turned the fund round, making it a consistently top quartile fund.
So in summary, I was lucky. Active funds can beat the index over the long term and justify their higher fees with better performance and returns. But everything hangs on fund selection… and as we all know past performance is not an indication of future performance.
We currently have another passive v active v robo experiment on the go (the Great British Wealth Off). Click here to read more.
—
If you’d like to receive a copy of the data, please get in touch.
CLOSE
Exciting news! We’ve revamped our brand and moved to a box-fresh consumer site — Compare+Invest has replaced CompareThePlatform (make sure you update your bookmarks).
Are you an adviser?
Don’t worry, we’ll still provide you with the tools and content you need, but we’re doing it on an adviser-dedicated site with a host of additional content and features.
