Understanding LISA interest rates: a comprehensive guide
Understanding LISA interest rates is crucial for individuals looking to make informed d...

How time flies! Our Great British Wealth Off experiment turned two on 2nd February 2019. Before we look at the results, let me remind you what the Great British Wealth Off experiment is all about.
We’re regularly bombarded with new findings or scientific discoveries that debunk everything that we’ve believed until now, and the consumer financial press is no different. Based on the financial press of recent years, you’d be forgiven for believing that the only right way to invest is through robo-advisers…
The problem is that these articles leave investors doubting their previous investment choices. An investor who has always used an adviser and has always bought active funds will be rightly concerned to read, in an article, that this is now the ‘worst way to invest’.
The industry and the press need to provide more balanced information on all the investment options available to investors to allow them to make informed decisions. But that doesn’t happen, so we decided to run an experiment that would show investors, in real time, the different investing options available and how they might perform over time.
The GBWO experiment
We called this unique experiment The Great British Wealth Off. The plan was to run it for a year. 2017 was an OK year for stock markets, but as volatility began to rise towards the end, we could see there was value in continuing the experiment for a further year. And we’re not done yet… 2019 is promising to be even more challenging (Brexit blah blah blah) so it will be good to monitor how our investments behave over a longer time period.
But back to the experiment. We invested across a range of investments and solutions, both passive and active, both advised and non-advised. We selected five different investments and started them on 2nd February 2017: One robo-adviser (Moneyfarm), one active fund of funds (Architas MA Active Progressive), two active multi-asset funds (MI Hawksmoor Vanbrugh and Royal London Sustainable World), and one passive fund of funds (Vanguard LifeStrategy 80% equity).
Only funds with the same Morningstar SRRI rating of 4 (out of 7) were selected (note that over time some of those risk ratings changed have changed and this is also confusing for ordinary investors). On Moneyfarm, I was profiled as a pioneering investor but chose a lower risk level (5 out of a possible 6).
In addition, we asked Graham Bentley at GBi2 to put together two portfolios, one active and one passive, to act as control portfolios for our wealth-off experiment. The control portfolios generated a Morningstar rating of moderate risk. Click here to see the original post and the funds included in the control portfolios.
Second birthday!
2018 was a rollercoaster year and it shows in the figures. As we know, the fourth calendar quarter was pretty dire. Most stock markets fell by at least 10% (Japan fell by 17%, Germany 15%, and France and the US by 14%). The UK FTSE All Share’s fall was relatively contained at 11%.
Our experiment’s quarter was from November to February, so much of the decline was captured in the previous GBWO review, but there was still a small contraction of around 1% during the period. Our investments should match or be better than this figure. Returns from our investments were a mixed bag with some up 1% on the previous quarter and some down. The worst performer was Architas with a 0.7% drop, but that was still (thankfully) better than the index’s performance.
Our best investment overall was the Royal London Sustainable World Trust bought three ways: direct from the fund manager, through a DIY platform, and through an adviser using an adviser platform. The difference between the three options is about £5, which, you could argue, is the price of advice.
| Investments | Type | Value (£) Nov 2018 | Value (£) Feb 2019 | Qtr Grth % | Overall Grth % | Risk prof |
|---|---|---|---|---|---|---|
| RL Sustain World DIR | Act | 357.09 | 361.14 | 1.1 | 20.4 | 5 |
| RL Sustain World DIY | Act | 357.18 | 361.11 | 1.1 | 20.4 | 5 |
| RL Sustain World ADV | Act | 352.80 | 356.07 | 0.9 | 18.7 | 5 |
| Active portfolio DIY | Act | 331.53 | 331.02 | -0.2 | 10.3 | 4 |
| VG LfStrat80% Eq DIR | Pass | 329.97 | 330.27 | 0.1 | 10.1 | 4 |
| Active portfolio DIR | Act | 329.67 | 328.92 | -0.2 | 9.6 | 4 |
| VG LfStrat80% Eq DIY | Pass | 328.53 | 328.53 | 0.0 | 9.5 | 4 |
| Active portfolio ADV | Act | 327.48 | 326.4 | -0.3 | 8.8 | 4 |
| Passive portfolio DIR | Pass | 320.13 | 324.15 | 1.3 | 8.0 | 4 |
| VG LfStrt 80% Eq ADV | Pass | 324.51 | 324.03 | -0.1 | 8.0 | 4 |
| Passive port DIY | Pass | 318.81 | 322.62 | 1.2 | 7.5 | 4 |
| Arch MA Act Prog DIY | Act | 324.33 | 322.59 | -0.5 | 7.5 | 4 |
| Arch MA Act Prog ADV | Act | 320.37 | 318.09 | -0.7 | 6.0 | 4 |
| Arch MA Act Prog DIR | Act | 321.66 | 319.53 | -0.7 | 6.5 | 4 |
| Hawks Vanbrugh DIY | Act | 318.6 | 319.5 | 0.3 | 6.5 | 3 |
| Passive portfolio ADV | Pass | 314.91 | 318.12 | 1.0 | 6.0 | 4 |
| Hawks Vanbrugh DIR | Act | 315.84 | 316.35 | 0.2 | 5.5 | 3 |
| Hawks Vanbrugh ADV | Act | 314.7 | 315.03 | 0.1 | 5.0 | 3 |
| Moneyfarm | Robo | 310.22 | 311.92 | 0.5 | 4.0 | 6 of 7 |
| FTSE All Share | 3257.66 | 3904.31 | 3859.46 | -1.1 | 18.5 | |
| FTSE 100 | 5922.01 | 7094.12 | 7034.13 | -0.8 | 18.8 |
You might think £5 is a lot to pay for investment selection, but the advice is much, much more than just selecting investments. That’s actually the easy bit. It’s the last step in a long advice chain that starts with fact-finding and runs through understanding clients’ life ambitions, financial planning, tax planning, life coaching and so much more. Some might argue, therefore, that £5 is pretty cheap for the all-around advice and expertise that comes with your bog-standard investment selection.
I love the RL Sustainable World fund. It’s ethically managed, has great performance and has significant appeal among today’s more ethically minded investors (with three avocado-munching, clean-living millennials at home, I speak with direct experience).
Rubbing shoulders with the Royal London fund in the top quartile were Vanguard LifeStrategy 80% equity fund and the Active control portfolio, both bought direct (to see what’s in the active portfolio click here). The adviser variants of these funds were in the second quartile of investments, which is pretty good given the additional cost of both advisers and advised platform fees.
When you buy directly from fund groups you don’t always get the best price; managing hundreds of small investors takes a lot of manpower, so fees reflect that cost. Some fund groups, of course, pride themselves on running a slick operation and offer better fees and efficient operation. Vanguard and its personal investor platform is a case in point, and costs are minimised because it only offers in-house funds.
Overall, investing through a platform results in lower fees. That’s because platforms with scale can invest larger amounts and negotiate better fees. Generally, it’s cheaper to buy through a platform rather than direct, but it’s worth noting that there are some exceptions. Vanguard’s D2C platform, which promotes its own funds and strategies, is a case in point.
The LifeStrategy fund bought direct has assets of £330.27, but when bought through a DIY platform or an adviser/adviser platform, the fund achieves assets of £328.53 and £324.03 respectively net of fees. On a £300 investment, the difference is minor (£6 in all) but if the portfolio was £3,000, £30,000 or £300,000 the differences start to become substantial and investors start to react differently.
Asset allocation is the key
What have we learned so far? The big takeaway (yep, sometimes I use crappy Americanisms, get over it) is that both active and passive funds have performed well, so it’s not a simplistic question of expensive active v cheap passive.
Apart from the Hawksmoor Vanbrugh, which significantly de-risked its portfolio and has a risk profile of 3, all our investments have roughly the same risk. So why have some performed better than others? The answer has to be asset allocation.
No single investment principle has more impact on portfolio performance than the diversification of investments and allocation to different asset classes. It won’t ensure that the portfolio will always perform well, but research has shown that a sizeable proportion of an overall portfolio’s positive performance over time is due to asset allocation.
Asset allocation is not a panacea or insurance against market downturns since, in the interconnected world we live in, there is a significant correlation between asset classes. But good asset allocation is a key part of long-term investing and should cushion investors from the worst. And as we can see from our experiment, both active and passive funds can be used for asset allocation purposes.
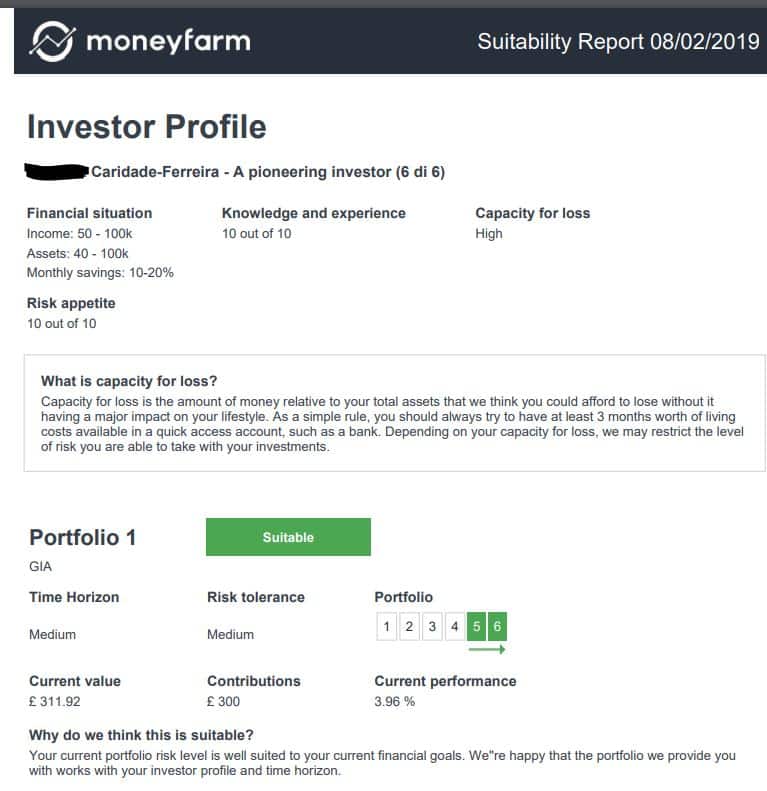
The not so pioneering portfolio…
Robo evangelists must be gritting their teeth in irritation at Moneyfarm’s lacklustre performance. As you can see from my suitability report below, my capacity for loss is 100%, my risk appetite is 10 out of 10, I’m a pioneering investor (the highest) but invested in the second riskiest of its six portfolios. The investment should be on a par with other investments in the GBWO experiment, but it’s not. So why is it doing less well than others?
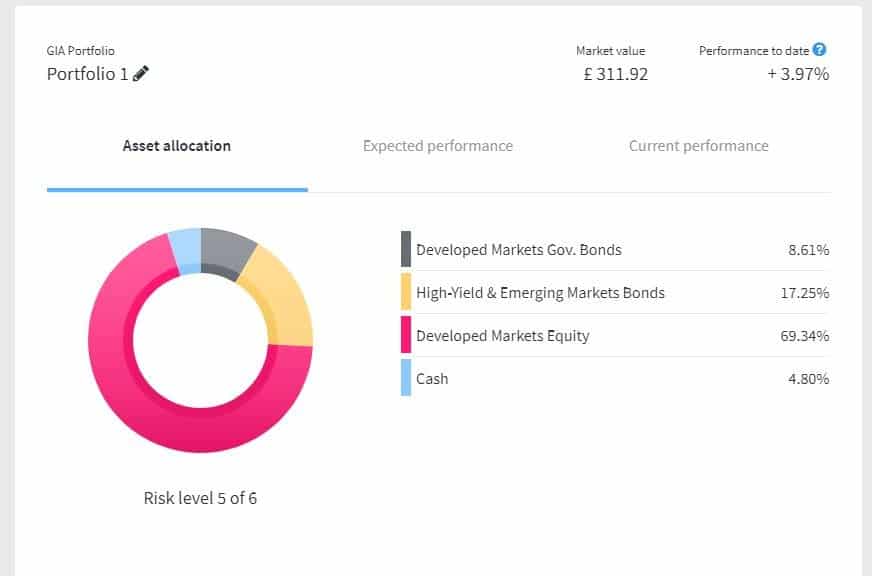
Moneyfarm portfolio composition
There are supposed to be seven ETFs in my account but there are only four. The young and charming investment consultant I spoke to yesterday (Chris) explained that because I only have £300 in the portfolio, Moneyfarm cannot buy the full range of ETFs for me (it doesn’t do fractional purchasing).
Only portfolios of £1500 get the full set of seven ETFs. That means that my asset allocation is less refined and somewhat blunt. According to Chris because it can only buy four ETFs, I am over-exposed to global equity. It also means that the underlying fees may be heavier than those of other ETFs.
Of the four ETFs in my portfolio, two have ongoing charges (OCFs) of 0.25% and two have charges of 0.55%. The fees could be a drag on performance and certainly, the 0.55% charge is closer to the institutional price of an active equity fund than the average 0.25% fees you’d expect on an ETF.
Luckily, the higher fund fees is offset by the fact that my Moneyfarm account attracts zero administration fees. I opened it when Moneyfarm was giving accounts away for free for investments below £12,000.

So it looks as though fees and poor asset allocation are the reason for the robo’s lacklustre returns. In addition, poor performance was exacerbated because Moneyfarm doesn’t trade ETFs fractionally. That means investors of more modest means lose out — at odds with its profile as a robo-adviser for investors of all shapes and sizes.
The other concern is that Moneyfarm doesn’t provide any benchmarks or reference indices to allow investors to make meaningful comparisons. Context is everything — there’s no point telling us that portfolios were up by 5% if we don’t know that the market was up by 25%. Without a benchmark, its portfolio charts are essentially meaningless to investors.
So come on Moneyfarm, sort out fractional ETF trading and add some context to your portfolio charts.
We’ll be back with an update in six months’ time. By then Brexit will have been done (or maybe not). Your guess is as good as mine!
We like experiments… we have another one starting tomorrow!
CLOSE
Exciting news! We’ve revamped our brand and moved to a box-fresh consumer site — Compare+Invest has replaced CompareThePlatform (make sure you update your bookmarks).
Are you an adviser?
Don’t worry, we’ll still provide you with the tools and content you need, but we’re doing it on an adviser-dedicated site with a host of additional content and features.
