Understanding LISA interest rates: a comprehensive guide
Understanding LISA interest rates is crucial for individuals looking to make informed d...

Following on from our recent article on the active v passive debate, the Rupert, the tracker and the deposit, we thought we should investigate whether investing a lump sum or regular investments over time would provide the best long-term return.
Financial markets can be turbulent places. You only need to look at the stock market rout in the first week of February when the Dow Jones swung wildly up and down and closed down by more than 1,000 points twice in the same week, having been at a record high of 26,616 days earlier. The attraction of investing with small and regular payments is that it smooths out these types of highs and lows, minimising the volatility faced by the investor. Known as ‘pound cost averaging’, it leads to investors buying fewer shares when prices are high and more when prices are low. Investing a lump sum means investors benefit from being invested from day one, but the risk is that they buy at the top of the market.
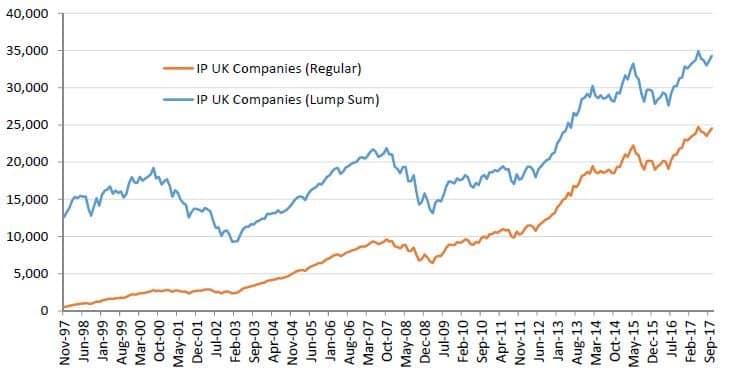
So how would our investments have fared over the past 20 years under the two investment plans? Using the Invesco Perpetual UK Companies fund from our previous analysis, we sourced the active performance data on a monthly basis from FE analytics (net of fund charges). The analysis ran over the 20-year period from November 1997 to October 2017.
The lump-sum plan was based on a single investment of £12,450 in the November 1997, while the regular investment plan was based on an initial lump sum of £500 in November 1997 followed by monthly investments of £50. This means that both plans involve a total investment of £12,450. We analysed the return on both an inflation-adjusted and non-inflation-adjusted basis using the monthly UK CPI inflation rate sourced from the Office of National Statistics (ONS).
Despite the ups and downs of the financial markets, the-lump sum investment delivers a superior return on the £12,450 investment. Investing in this way would have delivered an inflation-adjusted return of £34,304, outperforming the regular-investment option which delivered an inflation-adjusted return of £24,562.
| Lump sum | Regular investment | |
|---|---|---|
| Monetary return over 20 years adjusted for inflation (£) | 34,303.81 | 24,561.59 |
| Annualised real rate of return inf adjustment (%) | 5.20 | 5.20 |
| Monetary return over 20 years no inflation adjustment (£) | 47,889.37 | 30,794.81 |
| Annualised rate of return no inf adjustment (%) | 6.97 | 6.97 |
The chart clearly highlights how the lump-sum investment plan is initially subject to much greater swings in value as the whole investment is at risk from the beginning. Between December 2000 and December 2002, in the aftermath of the bursting of the dot com bubble, the-lump sum plan falls from £17,434 to £10,278 (-41.0%) while the regular investment plan falls from £2,738 to £2,532 (-7.5%). But the upside is that when the marketrecovered from 2003, onwards the value of the lump sum plan rose more than the value of the regular investment plan.
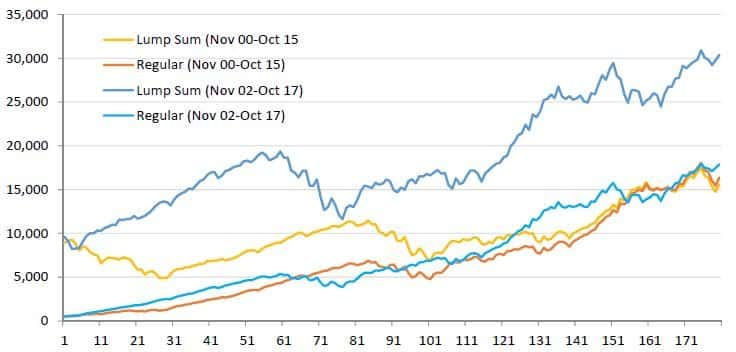
The biggest danger from lump-sum investing comes from investing at the peak of the market … So what happens if you do? We took November 2000, around the time of the height of the dotcom bubble as a start date and compared this to investing two years later near the bottom of the market in November 2002.
Making use of the Invesco Perpetual UK Companies fund for the analysis again, we sourced the active performance data on a monthly basis from FE analytics (net of fund charges ) for the periods from November 2000 to October 2015 and from November 2002 to October 2017. The lump-sum plan was based on a single investment of £9,450 in the first month (November 2000 and November 2002), while the regular investment plan was based on an initial lump sum of £500 followed by monthly investments of £50. Again, we analysed the return on an inflation-adjusted basis using the monthly UK CPI inflation rate sourced from the Office of National Statistics (ONS).
| Lump sum | Regular investment | |
|---|---|---|
| Nov 2000 – Oct 2015 Monetary return over 15 years adjusted for inflation (£) | 15,593.46 | 16,372.96 |
| Nov 2002 – Oct 2017 Monetary return over 15 years adjusted for inflation (£) | 30,390.92 | 17,877.97 |
The results highlight that when investing close to the top of the market in November 2000, the lump-sum plan is just beaten by the regular saving plan over the following 15 years, £15,593 v £16,373. But when making your investment two years later close to the bottom of the market in November 2002, the lump-sum plan is far superior returning £30,391 compared to the regular saving plan return of £17,878.
The most interesting aspect is that the regular saving plan invested at the top and bottom of the market, and the lump-sum plan invested at the top of the market all return relatively similar amounts over the 15 years. But investing a lump sum close to the bottom of the market delivers a stellar return almost double this. It is important to remember that timing the market is impossible so this is nothing more than a theoretical discussion.
With the squeeze on disposable incomes, the reality is that most of us don’t have the kind of money available to make sizeable single lump-sum investments. However, small monthly investments still build sizeable investments and pound-cost averaging works in our favour. The key to investment success is time in the market and not timing the market — it is better to invest now rather than save to invest a lump sum in the future.
A final point to consider is the impact of dealing costs. Whilst many platforms do not charge for fund dealing, there are some that do and charging for exchange-traded products dealing is more common. The impact of 12 dealing fees per year compared to only one on the return from the investment could also be significant.
CLOSE
Exciting news! We’ve revamped our brand and moved to a box-fresh consumer site — Compare+Invest has replaced CompareThePlatform (make sure you update your bookmarks).
Are you an adviser?
Don’t worry, we’ll still provide you with the tools and content you need, but we’re doing it on an adviser-dedicated site with a host of additional content and features.
