Understanding LISA interest rates: a comprehensive guide
Understanding LISA interest rates is crucial for individuals looking to make informed d...
So we’re now nine months into our Great British Wealth Off and the results are pretty interesting. But first a recap of what we’re doing and why we’re doing it.
Consumers have been bombarded with a huge amount of (often contradictory) information on the pros and cons of different types of investments. Active investments are often given bad press, while robo and passive investments are talked up and given almost mythical, can’t-go-wrong status.
This is confusing for the consumer. We wanted to show ordinary investors and consumers that sometimes there isn’t much difference between the outcomes of different investments – even when all the fees have been taken into account. Sometimes an active investment sold through an adviser performs better than a passive product bought direct. And vice versa. There are numerous contributory factors and so there is no right or wrong answer. It is not a binary decision. And that’s what this experiment is designed to demonstrate.
In an effort to prevent the inevitable attack of the trolls, I’d like to remind everyone that this is a consumer experiment. Let me say that again. A CONSUMER EXPERIMENT.
It’s not supposed to be about clever financial advisers or industry professionals understanding the nuanced benefits of different investments and why that might create performance differences. It’s about the array of choices a consumer might face, the difficulty of comparing the different investment options in the market, and the difficulty of making a choice on the information available to them.
To make sure we had a broadly comparable cohort of investments, we used risk ratings to select our investments. According to various risk profilers in the market I am a risk profile 8, but for the purpose of this experiment we went for a middle of the road 5 for our investments. (Click here for a full description in the February post and here for the August update).
When it comes to robo-advisers, however, it’s a little bit more complicated. Following our last review, Moneyfarm pointed out that we weren’t comparing like for like and that’s why our Moneyfarm investment had underperformed the others.
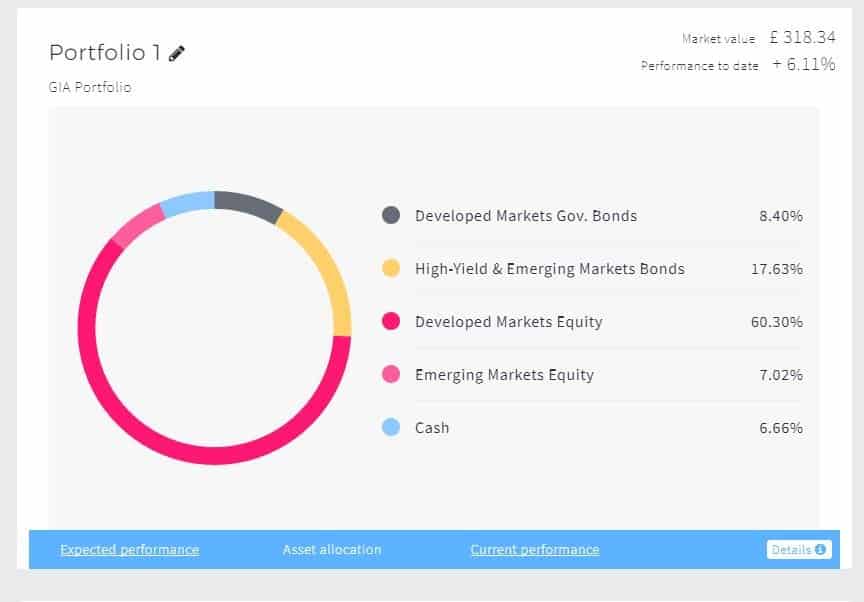
However, having answered the risk and financial behaviour questions, my Moneyfarm investor profile was Pioneering Investor which is the top of the scale in terms of attitude to risk and financial knowledge. It then put me through another set of questions (what it calls a risk fine-tuner), and this set my risk profile to 5 out of a possible 6 (with 1 being the most conservative and 6 being the most adventurous). So, in summary, my Moneyfarm risk level is actually higher. The portfolio (see image) is 67% equity based, and so, in theory, should be performing like the other passive investments.
Below is our table of 18 portfolios. They’re a mix of passive and active investments with two control portfolios (active and passive). We invested £300 in each on 2nd February 2017. So how have our investments performed? Let’s start by setting the scene. In the three months to end October, the stock markets were home to modest growth — the FTSE 100 rose by 1.6% and the FTSE All Share rose by 1.8%. The markets haven’t been kind this year, so year-to-date performance is 4.9% and 6.3% respectively. As a result, we would expect active investments to have outperformed these figures and passive investments to be roughly the same.
| Investments | Type | Value (£) Aug 17 | Value (£) Nov 17 | 3 Mth Grth % | YTD Grth % |
|---|---|---|---|---|---|
| Royal London Sustainable World, direct | Active | 330.48 | 354.27 | 7.20 | 18.09 |
| Royal London Sustainable World, DIY plat | Active | 330.63 | 354.24 | 7.14 | 18.08 |
| Royal London Sustainable World, adviser | Active | 329.46 | 352.38 | 6.96 | 17.46 |
| Active portfolio, DIY platform | Active | 321.09 | 335.91 | 4.62 | 11.97 |
| Active portfolio, direct | Active | 320.49 | 335.07 | 4.55 | 11.69 |
| Active portfolio, through adviser | Active | 319.95 | 334.14 | 4.44 | 11.38 |
| Vanguard LifeStrategy 80% Equity, direct | Passive | 315.96 | 330.09 | 4.47 | 10.03 |
| Vanguard LifeStrategy 80% Equity, DIY plat | Passive | 315.57 | 329.46 | 4.40 | 9.82 |
| Passive portfolio, direct | Passive | 317.01 | 329.10 | 3.81 | 9.70 |
| Passive portfolio, DIY platform | Passive | 316.65 | 328.50 | 3.74 | 9.50 |
| Vanguard Life Strategy 80% Equity, adviser | Passive | 314.49 | 327.72 | 4.21 | 9.24 |
| Architas MA Active Progressive, DIY platform | Active | 318.33 | 327.30 | 2.82 | 9.10 |
| Passive portfolio, adviser | Passive | 315.57 | 326.79 | 3.56 | 8.93 |
| Architas MA Active Progressive, direct | Active | 317.70 | 326.13 | 2.65 | 8.71 |
| Architas MA Active Progressive, adviser | Active | 317.25 | 325.53 | 2.61 | 8.51 |
| MI Hawksmoor Vanbrugh, DIY platform | Active | 314.58 | 323.28 | 2.77 | 7.76 |
| MI Hawksmoor Vanbrugh, direct | Active | 313.83 | 322.05 | 2.62 | 7.35 |
| MI Hawksmoor Vanbrugh, adviser | Active | 313.50 | 321.57 | 2.57 | 7.19 |
| Moneyfarm | Robo | 310.37 | 318.34 | 2.57 | 6.11 |
With the modest growth in the stock markets, it no surprise that the leading six investments in November are active since it is in this type of market conditions that good fund managers can make a difference.
Royal London’s actively managed World Trust (bought direct from RL) topped the charts with an asset value of £354.24. It grew by 7.2% in the last three months and for the year to date it has registered a whopping 18% growth — three times the FTSE All Share’s growth this year. Had we bought this investment through an adviser, the value would have been only fractionally lower.
Our control portfolios of active investments (selected by Graham Bentley of GBi2) have also performed well and the three sit in 4th, 5th and 6th places. In contrast, the actively managed Architas MA Active Progressive and Hawksmoor Vanbrugh products have not performed as well. For the Hawksmoor product in particular, the higher fees will have been a drag on performance. That doesn’t mean that their situation won’t change over the next few quarters – in the first quarter the Vanbrugh funds were the best performers — and as we all know, investments should be held for at least five years.
Most of the passive funds sat in the middle, which is to be expected in light of stock-market growth this year. Moneyfarm is also a passive investment and while it continues to sit at the bottom of the chart, its growth is on a par with the FTSE All Share for the year (see image below).
As I couldn’t afford to put more than £300 in each investment, the differences are relatively modest. But it’s worth noting that if we’d invested £3,000 the RL investment would now stand at £3,543 and the Moneyfarm investment at £3,183 — a difference of £359. If we’d invested £30,000, the RL investment would have grown to £35,427 in nine months compared to the Moneyfarm investment of £31,834 — a difference of £3,593.
Although slated to run for a year, we’ve decided to keep it going for longer. It will be interesting to see how our investments behave when the UK is in the throes of its departure from the European Union and the stock markets are in turmoil.
CLOSE
Exciting news! We’ve revamped our brand and moved to a box-fresh consumer site — Compare+Invest has replaced CompareThePlatform (make sure you update your bookmarks).
Are you an adviser?
Don’t worry, we’ll still provide you with the tools and content you need, but we’re doing it on an adviser-dedicated site with a host of additional content and features.
