Understanding LISA interest rates: a comprehensive guide
Understanding LISA interest rates is crucial for individuals looking to make informed d...
Our Great British Wealth Off (GBWO) experiment is now in its second year! The first year of the experiment ended on 1st February 2018 just as stock-markets were spinning out of control and moving into a more volatile period. Volatility was lower and stock-markets were flying high, giving passive investments (with their cheap-as-chips pricing), a more competitive edge. But now that volatility is on the rise, the GBWO experiment could start to look quite different. In particular, as passive funds track indices, they’re more vulnerable to market shocks — it’s when markets are contracting that active fund managers can prove their worth and dexterity.
This is a mini update on the GBWO – we’ll do a more comprehensive one at the half-year point. The first two months of our quarter (2nd Feb to 1st May) were home to a stock-market correction before markets finally bottomed out on 26th March and began to climb again. And over the three-month period, the FTSE 100 fell 8% before recovering lost ground and closing with a modest upturn of 1.4%. So how did that affect our investments?
Performance was mixed. None of them achieved the 1.4% growth of the FTSE 100 (understandable because of fees and asset mix) but the Royal London Sustainable World fund came the closest with just under 1% growth. At the other end of the spectrum, the Moneyfarm robo was down 2.6%. The active portfolio (our control portfolio) was also a strong performer, but the active Architas and Hawksmoor investments were also in negative territory.
| Investments | Type | Value (£) Feb 2018 | Value (£) May 2018 | Qtr Grth % | Grth to date % | Risk profile |
|---|---|---|---|---|---|---|
| RL Sustainable World, DIY plat | Act | 351.42 | 354.51 | 0.9 | 18.2 | 5 |
| RL Sustainable World, direct | Act | 351.45 | 354.42 | 0.8 | 18.1 | 5 |
| RL Sustainable World, adviser | Act | 348.96 | 351.42 | 0.7 | 17.1 | 5 |
| Active portfolio, DIY plat | Act | 333.81 | 334.68 | 0.3 | 11.6 | 4 |
| Active portfolio, direct | Act | 332.70 | 333.3 | 0.2 | 11.1 | 4 |
| Active portfolio, adviser | Act | 331.47 | 331.77 | 0.1 | 10.6 | 4 |
| Vanguard LifeStrat 80% Eq, direct | Pass | 326.10 | 328.38 | 0.7 | 9.5 | 4 |
| Vanguard LifeStrat 80% Eq, DIY plat | Pass | 325.26 | 327.36 | 0.6 | 9.1 | 4 |
| Passive portfolio, direct | Pass | 324.81 | 325.83 | 0.3 | 8.6 | 4 |
| Architas MA Active Prog, DIY plat | Act | 328.83 | 325.35 | -1.1 | 8.5 | 4 |
| Passive portfolio, DIY plat | Pass | 324.06 | 324.87 | 0.2 | 8.3 | 4 |
| Vanguard LifeStrat 80% Eq, adviser | Pass | 322.98 | 324.51 | 0.5 | 8.2 | 4 |
| Architas MA Active Prog, direct | Act | 327.45 | 323.49 | -1.2 | 7.8 | 4 |
| MI Hawksmoor Vanbrugh, DIY plat | Act | 324.48 | 322.83 | -0.5 | 7.6 | 3 |
| Architas MA Active Prog, adviser | Act | 326.55 | 322.5 | -1.2 | 7.5 | 4 |
| Passive portfolio, adviser | Pass | 321.78 | 322.05 | 0.1 | 7.3 | 4 |
| MI Hawksmoor Vanbrugh, direct | Act | 322.89 | 320.85 | -0.6 | 7 | 3 |
| MI Hawksmoor Vanbrugh, adviser | Act | 322.20 | 320.04 | -0.7 | 6.7 | 3 |
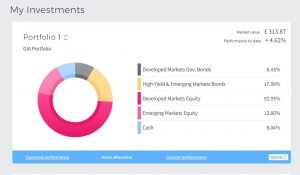
| Moneyfarm | Robo | 322.17 | 313.87 | -2.6 | 4.6 | 5 of 6* |
| Moneyfarm's risk profiler - 5 out of a possible 6. Pioneering investor. |
If we look at asset growth since the start of the experiment (2 Feb 2017), there is now a significant dichotomy between the best and worst performing portfolios. The RL Sustainable World fund (bought on DIY platform) has achieved growth of just over 18% to date and now stands at £354. Meanwhile the Moneyfarm robo-adviser is at the bottom of the table with just 4.6% growth since the start of the experiment, having grown to £314. If this difference is extended to larger investments and longer timescales, the impact on long-term investments would be substantial.
Moneyfarm may argue that we’re not comparing apples with apples, and they’re right because they’re not risk-profiled in the way that funds are. However, the point of this experiment was to choose investments as a consumer might do so. As a result, we went through Moneyfarm’s risk-profile system and came out with the second-highest risk-rating (5 out of a possible 6 – pioneering investor), which we think more than adequately compares to risk profile 4 of the funds we selected at the beginning of the experiment.
In addition, as you can see from the snapshot below, the portfolio has 14% in emerging market equity, 17% in high yield and emerging market bonds and 57% in developed equity – which sounds pretty punchy to me and puts it in the same league as funds in the mixed investment 40-85% share.
How to measure robo performance and choose the right one is something we’re tackling with our Robo Reckoner (TM), a neat little calculator that we’re launching soon to help consumers find the right one for them. If you’d like to be told when this launches, email us at info @ compareandinvest.co.uk.
Tune in in August for the half-year review. To catch up on this experiment since the beginning, click on the following links: Feb 2017, Aug 2017, Nov 2017, Feb 2018.
CLOSE
Exciting news! We’ve revamped our brand and moved to a box-fresh consumer site — Compare+Invest has replaced CompareThePlatform (make sure you update your bookmarks).
Are you an adviser?
Don’t worry, we’ll still provide you with the tools and content you need, but we’re doing it on an adviser-dedicated site with a host of additional content and features.
